Over 1000 of you have come to look at these graphs, but I still have too little feedback. Please tell
me what you think - thanks!
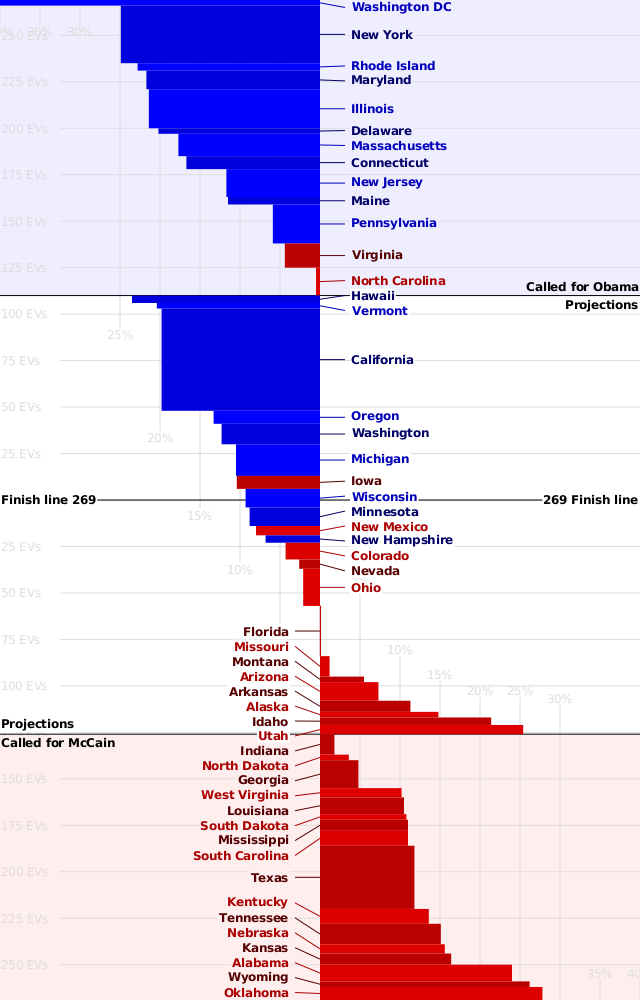
To make sense of any of this you must understand the Electoral
College.
-
Red states are states that went for Bush in
2004.
-
Blue states are states that went for Kerry in
2004.
-
States to the left of the line are projected
to go for Obama.
-
States to the right of the line are projected
to go for McCain.
-
The further left or right they extend, the further the projected
margin of victory
-
The thicker the bar for a state is, the more electoral votes it has.
-
The numbers inbetween states near the finish line mark how far that
boundary is from the finish line.
-
The projected winner is the person who takes the state on the finish
line.
-
Hover over a state for more information about it.
More information in my
diary entries - add that diary to your hotlist if this sort of thing interests you, I'll be doing more up to and during election night. I have a plan
for updating this graph during election night as states are called by the networks.
Data: fivethirtyeight.com 2008-11-02
ciphergoth